Monitor, Then Dig In: How AI Is Changing the Way Oil & Gas Analyzes Its Data
By Justin Birmingham, Whitley Penn Digital Services Partner
By Justin Birmingham, Whitley Penn Digital Services Partner
Key Takeaways
- AI is transforming oil & gas data analysis by helping teams quickly identify the root causes of operational and financial issues through natural language queries rather than time-consuming manual investigation.
- Automated reporting and dashboards remain essential for monitoring performance, but AI is becoming the fastest way to answer specific business questions and uncover insights.
- The success of any AI initiative depends on a strong data foundation, with clean, connected, and trustworthy data serving as the backbone for meaningful analytics and decision-making.
It’s the last week of the month, and a number on the report doesn’t look right. Costs jumped on a well or a compressor station, and nobody can say why — not yet. So, someone starts pulling exports, stitching spreadsheets together, and two days later you finally have an answer to a question you asked on Tuesday.
Every company in the Permian Basin knows some version of that scene, and it’s the part of the business that’s anticipating the most change. Artificial intelligence (AI) is reshaping how oil and gas companies work with their data — not by replacing the tools you rely on, but by making the slowest part, the digging in, dramatically faster.
For years, getting value from that data has come down to two things: automated reporting that keeps watch over the business, and dashboards that let you dig into it. Both are still essential. What’s changing is the digging in, and AI is emerging as the next step beyond the dashboard.
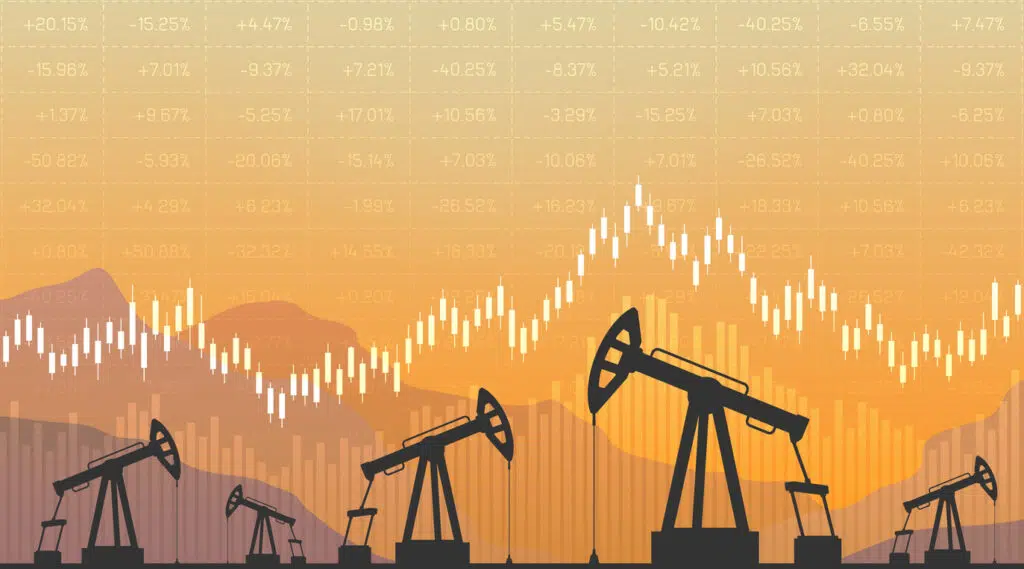
Automated reporting is how you keep an eye on the business without rebuilding spreadsheets. Refreshed on a schedule, it gives you a steady, current read — operating costs against budget, capital spend versus authorization for expenditure (AFE), revenue and margin, production or throughput against forecast — and flags when something drifts: a cost overrun, an asset running below expectation, a growing imbalance, unplanned downtime.
This is the layer that keeps watch. It tells you where things stand and when something needs a closer look. What it can’t do is tell you why.
When reporting flags something, you go in and investigate. Dashboards have been the best way to slice, filter, and drill into the numbers to find the story behind the exception. They’re powerful, but reaching an answer still means loading the dashboard, knowing which page or tab holds the story, and how to drill into it.
AI is the next way to dig in. Instead of clicking through filters hoping the right view exists, or waiting on an analyst to build one, you ask the question directly, in plain language: Which assets are running more than 15% below expectation this month, and what changed? What drove the jump in operating costs at that facility? Where did these imbalances start? You get an answer in seconds. You don’t have to know where the answer lives, or how to get to it.
Dashboards aren’t going away, and the two do different jobs well: a dashboard is where you explore the numbers visually and catch what you weren’t looking for, while AI is where you turn when you have a specific question and want an answer now. For that, the moment you need to know why, asking is becoming faster than clicking. Monitor, then dig in.
Automated reporting is how you keep an eye on the business without rebuilding spreadsheets. Refreshed on a schedule, it gives you a steady, current read — operating costs against budget, capital spend versus authorization for expenditure (AFE), revenue and margin, production or throughput against forecast — and flags when something drifts: a cost overrun, an asset running below expectation, a growing imbalance, unplanned downtime.
This is the layer that keeps watch. It tells you where things stand and when something needs a closer look. What it can’t do is tell you why.
When reporting flags something, you go in and investigate. Dashboards have been the best way to slice, filter, and drill into the numbers to find the story behind the exception. They’re powerful, but reaching an answer still means loading the dashboard, knowing which page or tab holds the story, and how to drill into it.
AI is the next way to dig in. Instead of clicking through filters hoping the right view exists, or waiting on an analyst to build one, you ask the question directly, in plain language: Which assets are running more than 15% below expectation this month, and what changed? What drove the jump in operating costs at that facility? Where did these imbalances start? You get an answer in seconds. You don’t have to know where the answer lives, or how to get to it.
Dashboards aren’t going away, and the two do different jobs well: a dashboard is where you explore the numbers visually and catch what you weren’t looking for, while AI is where you turn when you have a specific question and want an answer now. For that, the moment you need to know why, asking is becoming faster than clicking. Monitor, then dig in.
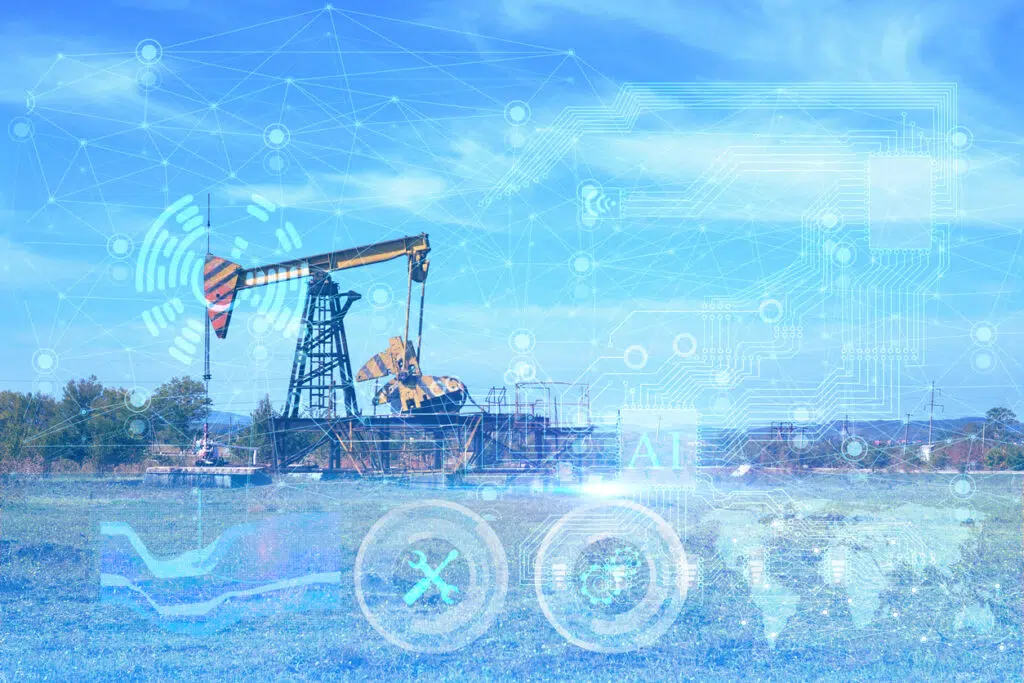
Dashboard and AI must rest on a solid data system. Automated reporting, dashboards, and AI are only as good as the data feeding them, and in this business, that data is generated everywhere. Production and throughput volumes, sensor readings, capital and operating costs, revenue, most of it living across separate systems that don’t talk to each other.
A data warehouse or lakehouse is what pulls those sources into one place, keeps them clean and current, and makes everything above possible. You’re rarely starting from scratch. The data already exists in the systems you run every day. Consolidating it into one clean, current, trustworthy place is the real work. Without a solid foundation, AI can only reflect the chaos underneath it.. Point it at a well-maintained foundation and it becomes genuinely useful. The intelligence everyone is excited about is real, but it’s downstream of the unglamorous part.
Dashboard and AI must rest on a solid data system. Automated reporting, dashboards, and AI are only as good as the data feeding them, and in this business, that data is generated everywhere. Production and throughput volumes, sensor readings, capital and operating costs, revenue, most of it living across separate systems that don’t talk to each other.
A data warehouse or lakehouse is what pulls those sources into one place, keeps them clean and current, and makes everything above possible. You’re rarely starting from scratch. The data already exists in the systems you run every day. Consolidating it into one clean, current, trustworthy place is the real work. Without a solid foundation, AI can only reflect the chaos underneath it.. Point it at a well-maintained foundation and it becomes genuinely useful. The intelligence everyone is excited about is real, but it’s downstream of the unglamorous part.
None of this is reserved for companies with big internal data teams. Start with one workflow that causes real pain, monthly cost reporting, production or throughput surveillance, capital tracking. Get the data connected and trustworthy, put automated reporting on it so it’s monitored, then add the ability to ask questions when something looks off. Prove it in one place, then let it spread.
That’s where a digital services partner earns its keep. Building the foundation and layering reporting and AI on top is specialized work, and the skill sets are scarce. Partnering with a team that has strong experience can get you from scattered data to real answers in weeks, without standing up a department to do it. The companies that get the most out of AI over the next few years won’t be the ones with the most data or the flashiest tools. They’ll be the ones whose foundation was solid enough to build on, and who had the right help building it.
Get in Touch

Justin Birmingham
Digital Services Partner
Justin Birmingham is a data engineering leader with over 15 years of experience designing and delivering scalable data solutions across cloud platforms. He combines technical precision with strategic thinking to help organizations transform raw data into actionable insights. Justin’s strengths include building cloud-native data warehouses, developing advanced SQL-based analytics, and leading end-to-end ETL architecture. Justin is skilled in statistical modeling, predictive analysis, and business intelligence enablement, particularly within complex industries like energy.
Hover over Justin’s headshot to view his contact information and full bio.