Let's Talk March Madness 2026
It’s that time of year again – brackets, buzzer‑beaters, heartbreak, and a whole lot of data.
Just like we empower our clients to make decision‑ready, insight‑driven choices, our Digital Services team has been crunching the numbers to predict who’s most likely to cut down the nets this year. You bring the bracket… we’ll bring the analytics!
What the Data Says
This year, we tightened and refreshed our model by looking at slightly updated performance metrics – plus the tried‑and‑true KenPom efficiencies that continue to be the gold standard. And one stat hasn’t changed:
Every NCAA Champion, since KenPom’s inception 24 years ago, has ranked at least Top 57 in Offensive Efficiency and Top 44 in Defensive Efficiency.
Combine those with our updated performance thresholds, and we’ve identified the teams that statistically have what it takes to win it all:
PPG > 71.4
Opponent PPG < 72
3FG% > 32.9%
FG% > 43.4%
ORPG > 8.8
RPG > 34.6
APG > 12.2
FTA > 15.7
TO < 12.9
Opponent TO > 10.6
Opp FG% < 43.3%
Combine those with our updated performance thresholds, and we’ve identified the teams that statistically have what it takes to win it all:
PPG > 71.4
Opponent PPG < 72
3FG% > 32.9%
FG% > 43.4%
ORPG > 8.8
RPG > 34.6
APG > 12.2
FTA > 15.7
TO < 12.9
Opponent TO > 10.6
Opp FG% < 43.3%
Based on data from the past 20+ NCAA Champions, here are the teams that meet this year’s winning profile:


We’ve Taken It Even Further
Our models identified the nine teams that meet this year’s championship‑winning statistical profile – but we didn’t stop there. We pressure‑tested those teams using some of the wildest, most historically consistent anomalies in March Madness history.
Here’s how the field shrank even more:
The “Graveyard Seed Rule” – For four decades, 1, 2, and 3‑seeds have won almost every national title, with only a handful of exceptions. 35 of the past 40 champions have been a top 3 seed.
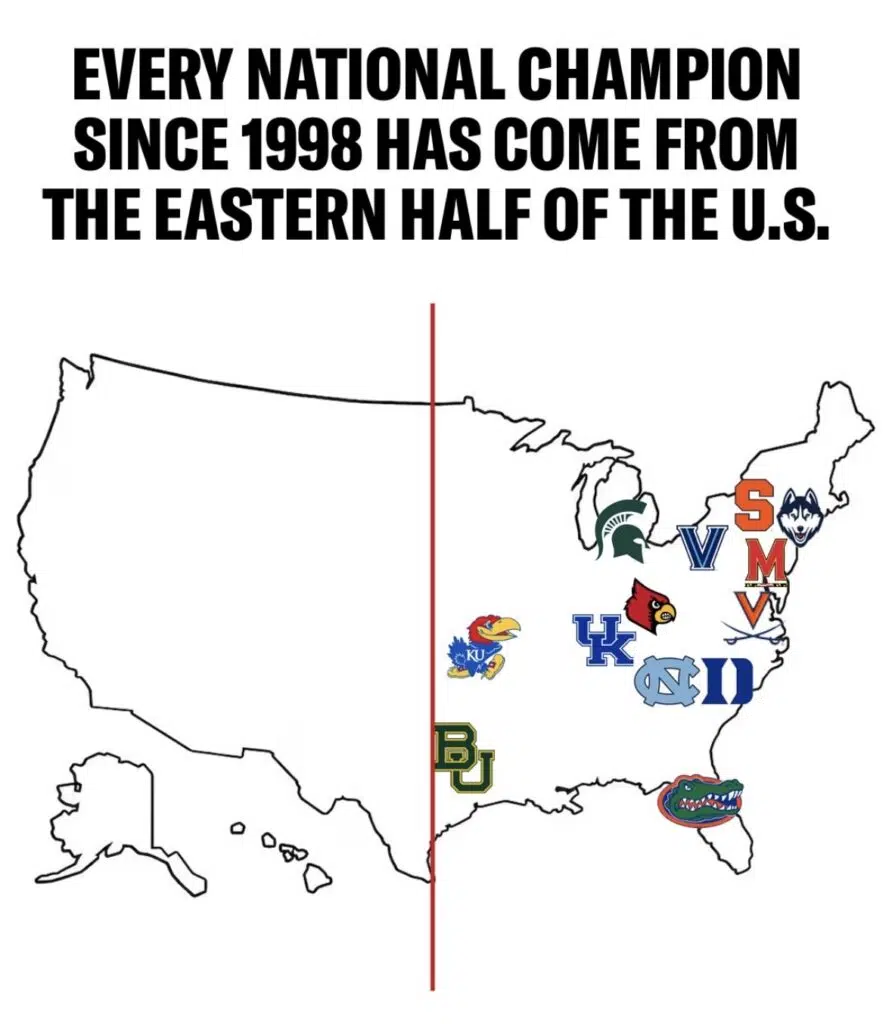
The “Western Half” Curse – Since 1998, not a single team located in the western half of the country has won the national championship. Twenty-Seven straight tournaments… zero titles. Geography has become an unexpected tiebreaker.
The Big Ten Title Drought – Despite eight championship‑game appearances since 2000, the Big Ten is 0‑for‑8 in its last eight shots at the trophy – one of the longest, strangest droughts in modern sports.
Using these three filters, the nine qualifying teams narrowed themselves into a clear Final Four. The Surviving Contenders – Duke, Connecticut, Houston, and Virginia.
Now we have not only the teams that statistically can win…but the teams that historically DO win.
Why This Matters (Beyond Bragging Rights)
This exercise is a fun reminder of the power of good analytics: better inputs = better decisions.
If your clients are looking for ways to better leverage their data – whether through dashboards, automation, or advanced analytics – our team is here to help.
Transform Your Data into Insights
Discover how our Digital Services can help you make informed decisions (outside of your tournament brackets!).
